Chicago Bicycle
Accident Lawyer
Accident Lawyer
Injured in a Bicycle Accident? We Can Help.


How traffic signals impact bicycle accidents is a key issue for cyclists and other road users throughout Illinois.
Traffic signalization is meant to organize movement and reduce conflict points, but when signals are missing, misinterpreted, or disobeyed, the chances of bicyclist injuries rise sharply. These problems are especially common at signalized intersections and in areas where motor vehicles and bikes share space.
This guide breaks down how traffic signals contribute to both the prevention and cause of bicycle crashes, and how signal-related factors influence legal liability in cases involving serious injury or property damage.
The way signalized intersections are built can have a direct impact on bicyclist safety. Design elements like turning lanes, medians, and lane width affect how road users behave, especially when motor vehicles and bicycles meet at conflict points.
Research analyzing over 500 bicycle–motor vehicle collisions at signalized intersections found that a greater number of turn lanes and wider medians significantly increased the risk of crashes. These features tend to encourage higher speeds and create more conflict points between road users.
Conversely, narrower entry points and higher bicycle volumes were linked to fewer crashes, suggesting that more visible cyclist presence and compact designs may improve outcomes. These findings offer valuable insights for city planners aiming to reduce bicyclist injuries through smarter traffic signal placement and intersection design.
Roundabout design plays a significant role in cyclist safety, with specific configurations reducing crash risk while others raise it. Overall, the installation of roundabouts has been associated with an 8% reduction in crash rates and a 30% drop in cyclist injuries.
The safest designs include separate cycle tracks, which showed injury reductions of up to 90%. In contrast, roundabouts with only painted cycle lanes saw less improvement or even increased crash rates.
Two-lane roundabouts were found to have more than double the expected number of crashes, while single-lane designs performed better, especially those with larger central islands and separate bikeways.
Roundabouts in high-traffic areas or with high-speed vehicle entries tended to show increased risk. These findings emphasize the importance of protective infrastructure and speed management in roundabout design.
Raised and colored bicycle crossings influence crash rates in different ways, depending on their design and how many are used.
Studies on raised crossings showed a slight increase in total crashes, but these areas also experienced a significant increase in bicycle traffic, about 50% higher than comparable roads. This suggests that, despite more observed crashes, the intervention may have improved safety per rider.
Colored bicycle crossings showed mixed results. When a single colored crossing was added, injury and crash rates dropped by 10% and 19%, respectively.
However, intersections with multiple colored crossings experienced sharp increases in both injuries and crashes, up to 139%. These patterns may reflect driver confusion or poor signal coordination, highlighting the need for careful planning when integrating visual cues into cycling infrastructure.
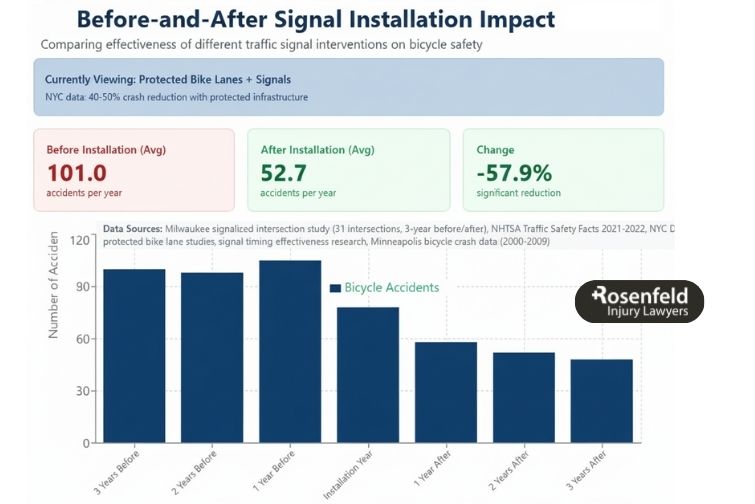
Multiple studies support the safety benefits of protected bike lanes. Cyclists riding in on-road bike lanes or marked bike routes experienced significantly lower crash rates and injury risks compared to those on major streets or off-road paths.
One extensive study found that crash rates per million miles were 58 on bicycle lanes versus 114 on major roads. Serious crashes were also lower, at 25 per million miles in bike lanes versus 77 off-road.
A separate study estimated that bicycle lanes reduced car-bike collision frequency by 53%. Other research using relative danger indices found bike lanes had one of the lowest risk scores (0.41), much safer than sidewalks (16.3) or off-road trails (4.49). Cyclists who primarily used bicycle lanes were less likely to report collisions or falls.
One short-term study noted an initial spike in crashes when a bike lane was added on the left side of a one-way street, but long-term crash rates remained stable. Overall, protected bike lanes improve bicyclist safety when well integrated into road design.
Cycling on sidewalks is consistently linked to higher crash risk and more severe injuries compared to on-road cycling or riding in designated bike lanes. One study reported a relative danger index of 16.3 for sidewalks—the highest among all infrastructure types—indicating a disproportionate number of crashes occur on sidewalks compared to how often they are used.
Sidewalk riding was associated with a risk of injury four times higher and a fall risk up to nine times greater than cycling on roads. Cyclists using sidewalks also faced twice the risk of collisions compared to those riding in travel lanes.
Although some people view sidewalks as safer due to separation from motorized vehicles, the data show otherwise. The elevated risks are likely due to conflicts at driveways and intersections, reduced visibility, and unpredictable interactions with pedestrians.
Across studies, sidewalks consistently emerge as one of the least safe options for cyclists, especially in urban areas with high traffic volumes and complex turning movements.
Specific road design features can significantly influence the severity of bicyclist injuries in crashes with motor vehicles. Research found that grades (slopes)—whether on curves or straight sections—were linked to more severe injuries, as were poor lighting conditions at night, especially on roads without streetlights.
Additional factors tied to higher injury severity included higher speed limits, lower traffic volumes, and adverse weather conditions like fog.
Urban studies also showed that wider roads, visible grades, and one-way street configurations were associated with increased injury severity. Cyclists were also more likely to suffer serious harm on highway-type roads and on streets that hadn’t been resurfaced in a decade.
Together, these findings suggest that how roads are built and maintained—including lighting, slope, width, and surface quality—can have a direct effect on the outcome of bicycle crashes, especially in areas shared with motor vehicles.
Analysis of over 3,000 bicycle injury cases found that motor vehicle involvement was the most significant predictor of severe injury, with an odds ratio of 4.6. In contrast, riding on unpaved surfaces was associated with a lower risk of severe injury (odds ratio = 0.7), though this result was not statistically significant.
The study adjusted for factors such as age, speed, and helmet use, reinforcing that crashes involving motorized vehicles remain the primary driver of serious injury outcomes, regardless of surface conditions.
Street lighting plays a significant role in reducing both the likelihood and severity of bicycle injuries. One study analyzing nearly 3,000 bicycle–motor vehicle crashes found that unlit roads at night significantly increased the chances of severe or fatal injuries, especially when combined with curved roads and undivided street designs.
A separate large-scale analysis of approximately 125,000 crashes found that the presence of street lighting on rural roads reduced cyclist injury rates by about 60% compared to crashes in darkness on unlit roads.
These findings suggest that poor visibility—especially at night and in areas without dedicated lighting—substantially raises the risk of serious injuries for cyclists. Improving lighting on both urban and rural roads is a key traffic safety measure for reducing crash severity and enhancing bicyclist safety.
A five-year analysis of 269 signalized intersections revealed 1,218 total crashes, averaging 0.91 crashes per intersection per year. Crash rates were highest at major intersections (1.13), followed by medium (0.90) and minor intersections (0.55). This pattern held across various infrastructure and operational characteristics.
The vast majority of crashes (87%) led to slight injuries, while 13% resulted in severe injuries, and only five crashes were fatal, limiting deeper severity analysis.
Crashes involving turning vehicles accounted for 53% of all incidents, making them the most common type, especially at major intersections, where they comprised 62% of crashes, compared to 34% at minor intersections.
In contrast, loss-of-control crashes were more common at minor intersections (28%) than at major ones (5%). Right-of-way and other crash types showed less variation across intersection categories.
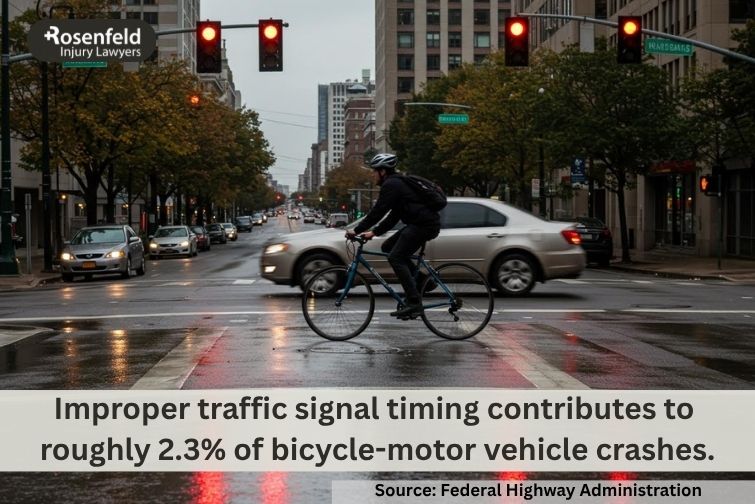
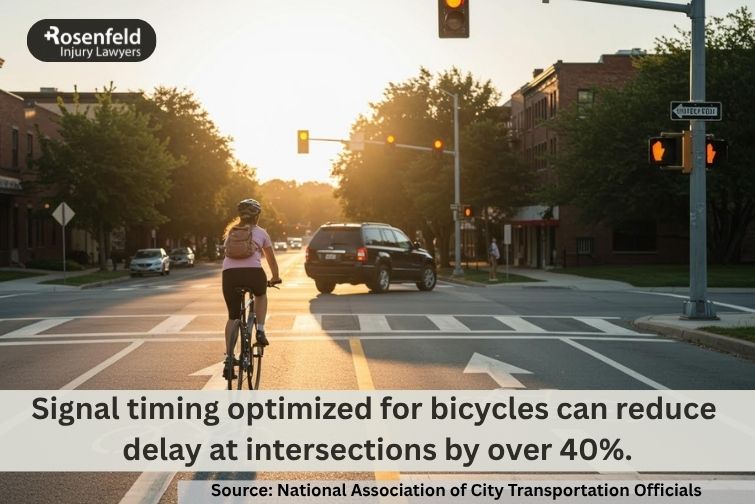
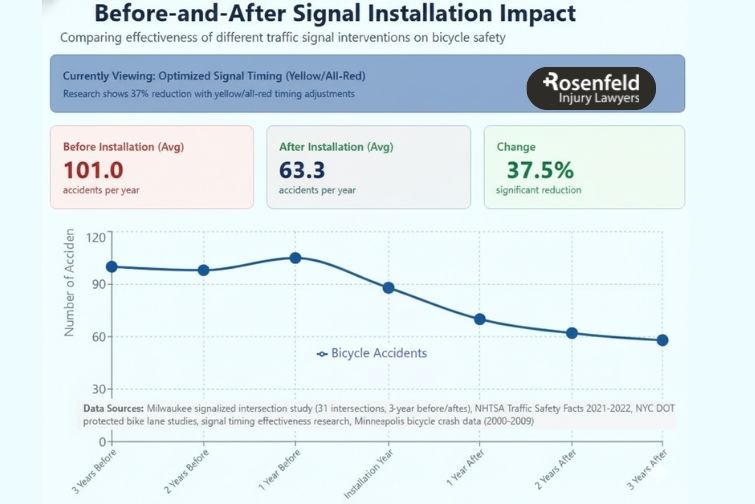
Protected or separate signaling for turning motor vehicles, where bicycles are given distinct signal phases, reduces crash rates and crash likelihood at intersections. While this approach improves road safety, it can also lead to longer signal cycle times, increasing waiting times for all road users.
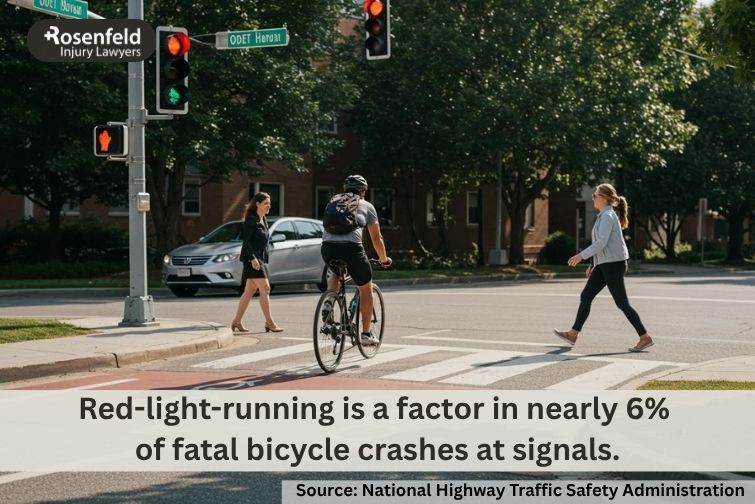
Longer waits may reduce compliance and lead more cyclists to ignore traffic lights, raising crash risks. Research shows that red light running is influenced by both personal and situational factors, including age, gender, rider type, group size, and direction of travel.
The presence of other road users affects behavior, with cyclists more likely to run red lights when no one is around, especially in the absence of vehicles.
Infrastructure also plays a role. Longer crossing distances tend to reduce red light violations, while bicycle tracks show higher rates of red light running compared to riding in mixed traffic. These insights highlight the need to balance bicycle safety with signal timing and user behavior.
Turning crashes between motor vehicles and bicyclists are strongly influenced by traffic volumes. Higher vehicle volumes are consistently associated with a disproportionately high risk, while bicycle volumes also show a positive but smaller effect.
At major intersections, having four arms significantly increases turning crash rates, likely due to added complexity and more conflict points. Signal timing plays a key role across all intersection types except minor ones.
Intersections with three or more signal stages, especially those allowing protected turning phases, show a notable reduction in turning crashes. This supports the importance of separating conflicting movements by time.
For medium intersections, the presence of cycle tracks (compared to other bicycle facilities) significantly reduces crash risk. Features like bend-outs—where the bicycle track curves away from the main road‚may help by creating a clear space for drivers to yield before crossing cyclists’ paths.
At minor intersections, none of the infrastructure or signal-related variables were significant. Their smaller size and simpler layout may inherently reduce turning conflicts, even when road users share green times.
Higher bicycle volumes are significantly associated with increased right-of-way crashes across all intersection types. Motor traffic volumes, however, only show a significant effect at major intersections, where higher vehicle presence likely increases exposure but discourages red light running due to longer crossing distances and heavier traffic.
At medium intersections, the effect of motorized traffic volume is not significant. This may be because lower traffic volumes increase the likelihood of red light violations, which offset the exposure-related risk.
A higher number of signal stages is linked to more right-of-way crashes at both major and medium intersections. This trend, opposite to what is seen in turning crashes, may be explained by longer cycle times, which could encourage red light running among impatient road users.
At major intersections, the presence of bicycle tracks significantly reduces crash likelihood. This may be due to improved separation between cyclists and vehicles and shorter crossing distances. No model was generated for minor intersections due to low crash counts and limited variability.
Loss-of-control crashes show fewer significant explanatory variables compared to other crash types. Models could only be estimated for all intersections combined and for minor intersections, where these crashes are more common.
Bicycle volumes are significant only at minor intersections, indicating that cyclist activity is a relevant factor in these lower-volume, compact settings. Motorized traffic volumes were not important in any model, suggesting a limited influence on this crash type.
The presence of tram tracks is a strong predictor of loss-of-control crashes, especially at minor intersections. These settings often expose cyclists to mixed traffic and narrow street designs, increasing the chance of wheels catching in tracks.
Other infrastructure-related variables were not significant. This may point to external factors–such as slippery surfaces, speed, poor visibility, or intoxication–as essential contributors. Notably, a higher share of crashes occurred at night and outside of peak hours, possibly reflecting risky behavior in low-traffic conditions.
Under the Illinois Vehicle Code (625 ILCS 5/), both motorists and cyclists are legally required to follow traffic laws, and violations by either party can impact fault determination in a bicycle accident case.
Common violations that may influence liability include a driver’s failure to yield to a cyclist at intersections or during turns, not allowing the required minimum three feet of passing distance, running red lights or stop signs, and distracted or impaired driving. Cyclists can also be at fault if they ride against traffic, ignore traffic lights and signals, or fail to use proper signaling.
Illinois also follows a modified comparative negligence rule under (735 ILCS 5/2-1116). A cyclist may still recover damages if they are found to be partially at fault, but their percentage of fault reduces their compensation.
However, if the cyclist is more than 50% at fault, they are barred from any recovery. For example, if a cyclist is found 20% at fault for not using a hand signal and the driver is 80% at fault for making an illegal turn, the cyclist would recover 80% of their total damages. So, in a $100,000 claim, the cyclist would receive $80,000.
An experienced bicycle accident lawyer can play a crucial role in protecting your rights and pursuing fair compensation after a crash. In these cases, we investigate the accident thoroughly, including reviewing police reports, traffic camera footage, and witness statements to determine fault, especially when violations of the Illinois Vehicle Code may be involved.
We also handle communications with insurance companies to prevent you from being pressured into unfair settlements. If your case involves complex legal issues such as comparative negligence, we’ll work to minimize your share of fault and maximize your recovery.
Additionally, we can calculate the full extent of your damages—medical bills, lost income, and the long-term effect a crash can have on your mental health—and pursue compensation through negotiation or litigation. Our goal is to take the legal burden off your shoulders so you can focus on healing while we fight for the outcome you deserve.
Yes, vehicle design plays a significant role in both crash likelihood and the severity of pedestrian and cyclist injuries.
Between 2009 and 2016, fatal single-vehicle crashes involving SUVs rose by 81%–the highest increase among vehicle types. Research attributes this trend primarily to the height and shape of SUV front ends.
Vehicles with hoods higher than 40 inches are about 45% more likely to cause pedestrian fatalities than those with lower, sloped hoods. Even medium-height vehicles with blunt front ends increase fatality risk by 26%.
The taller and blunter the vehicle’s front, the more dangerous it becomes, especially as speed increases. For example, at 30 mph, a midsize pickup has a 76% risk of causing serious injury, compared to 37% for a midsize car. Crash-avoidance technologies like automatic emergency braking with cyclist detection can reduce collision rates by 27%.
Helmet use significantly reduces the risk of serious head injury in bicyclist crashes. Research indicates that helmet use can reduce the odds of head injury by up to 50% and facial or neck injuries by 33%.
Absolutely. Research shows that even small increases in vehicle speed significantly raise the risk of severe injury or death in a crash involving a cyclist. The chance of serious injury to a cyclist increases from 18% at 20 mph to over 90% at 45 mph. At 55 mph, nearly every crash results in a serious injury or fatality.
Urban speed reduction can be achieved through engineering methods such as speed humps, multiway stop signs, and intersection-based traffic calming. These tools are useful in slowing general traffic flow, including vehicles making left turns. Setting lower speed limits on city roads also reduces the frequency of high-speed driving, which can lower the risk of pedestrian and bicyclist injuries.
If you or a loved one has been injured in a bicycle accident, don’t navigate the legal process alone. Our team is here to help you understand your rights, assess your options, and fight for the compensation you deserve. We offer a free, no-obligation consultation to evaluate your case.
You won’t pay any legal fees unless we win your case. Our Chicago bicycle accident law firm works on a contingency fee basis, which means we only get paid if we secure a settlement or verdict in your favor.
Reach out today to schedule your free consultation. We’ll review the details of your accident, explain your legal options, and help you take the next step toward justice and recovery.
Content reviewed by Chicago bicycle accident lawyer Jonathan Rosenfeld of Rosenfeld Injury Lawyers LLC, who holds negligent drivers, municipalities, and corporate defendants accountable to protect injured cyclists and their families, and is a trial lawyer recognized by National Trial Lawyers, Best Attorneys of America, and the National Association of Personal Injury Attorneys for high-severity injury claims.